
CentOS Monitoring
Monitor Linux Metrics, Logs, and Events in Real Time
Dozens of key metrics and logs at your fingertips!
monitoringlogsoperating system
- Ensure minimal downtime
- Benefit from predictable resource usage
- Scale effectively based on load
- Starts at only $2.8/host/month
Already have an account?
Sign in to get started.
What you get
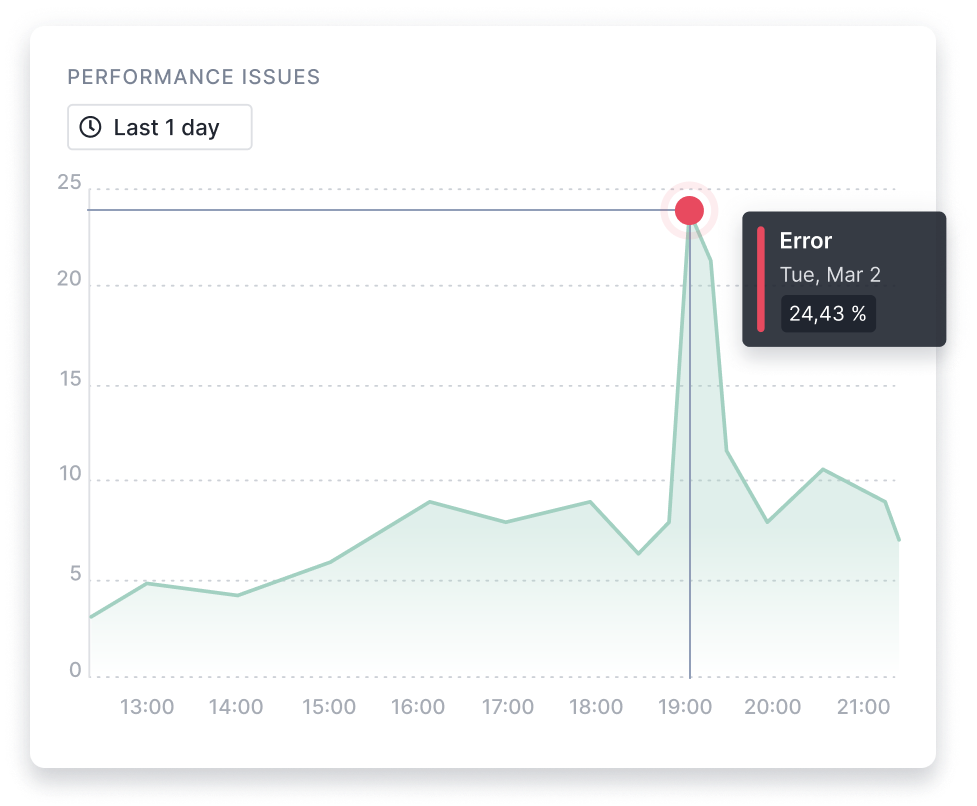
Find Performance Issues Faster
- Simple agent setup with extremely low overhead and no dependencies
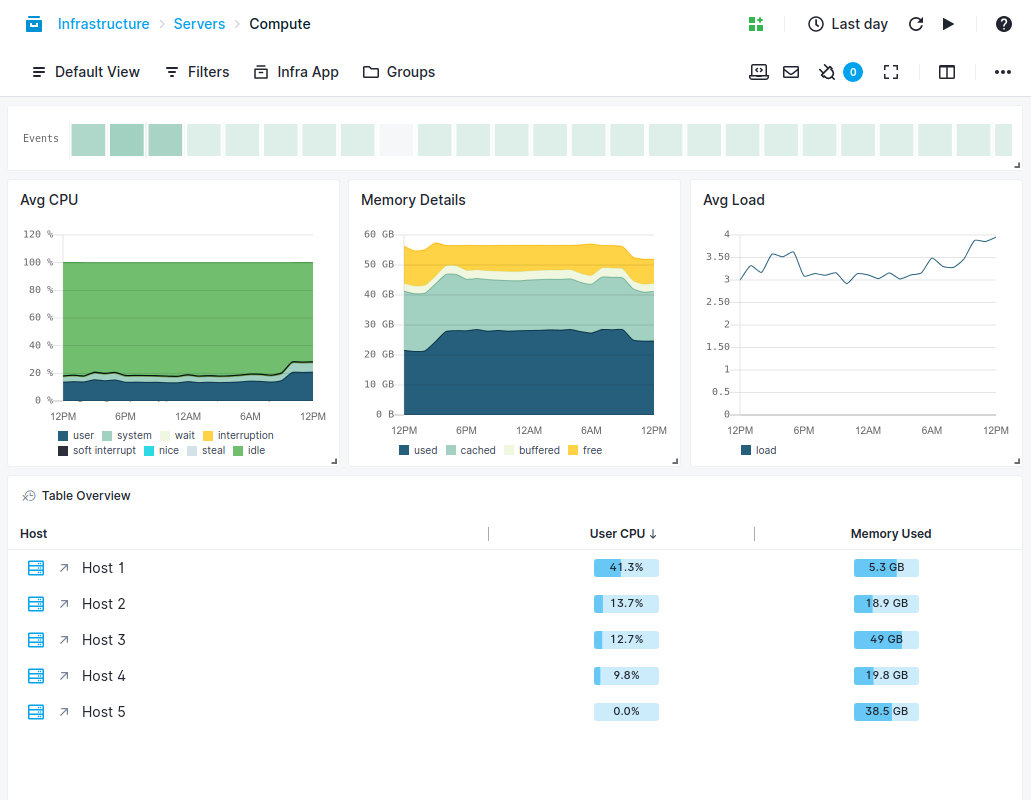
- Monitor all key Linux metrics and get infra performance monitoring charts out of the box
- Collect logs, key Linux metrics and events to cut troubleshooting time in half
- Set up anomaly detection or threshold-based alerts on any combination of metrics and filters
Installation
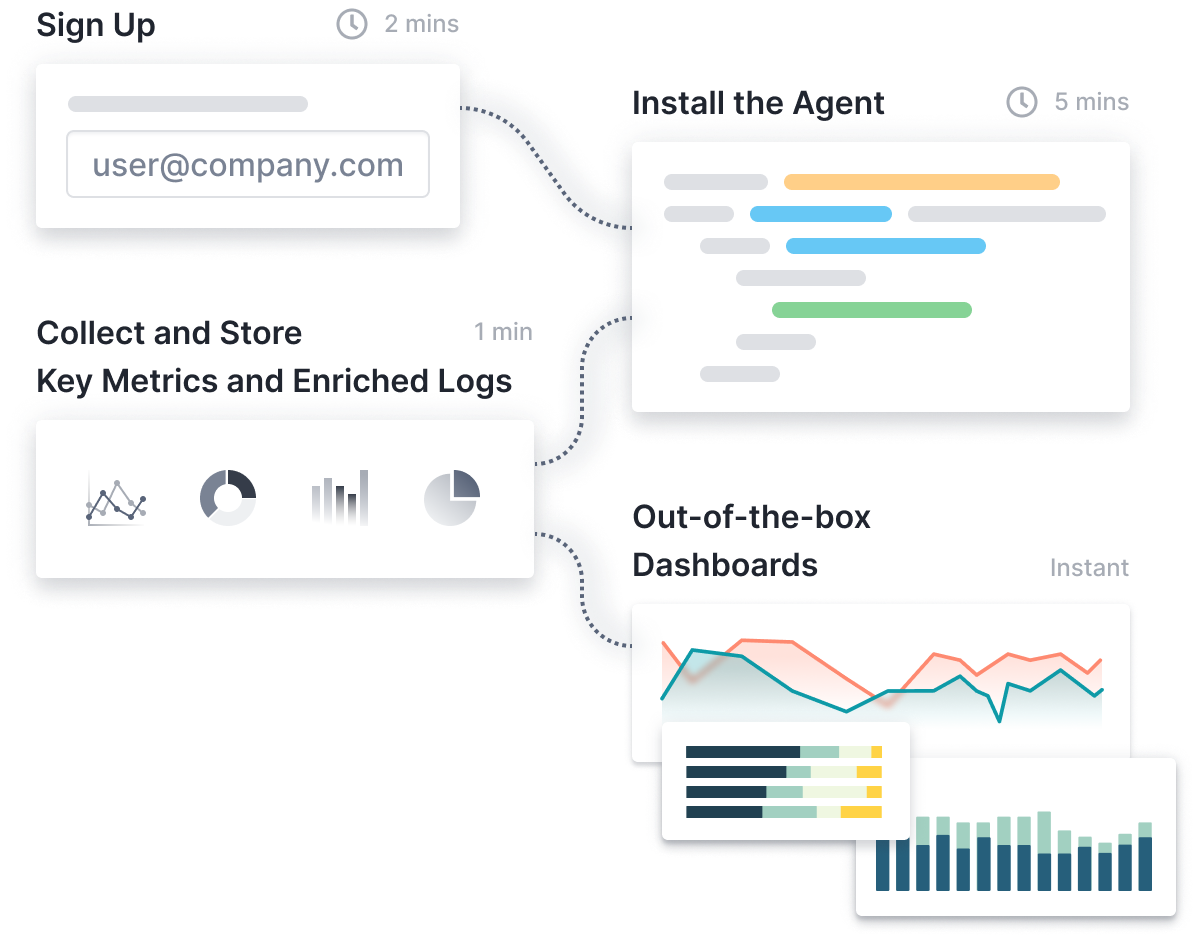
Get Started in Seconds
- Install the agent in seconds. Check out the Sematext Agent docs for more details.
- Supported across any distro, Ubuntu, CentOS, Red Hat, and many more
- Use Discovery to discover and monitor services inside containers
- Select which logs and metrics to collect from the UI
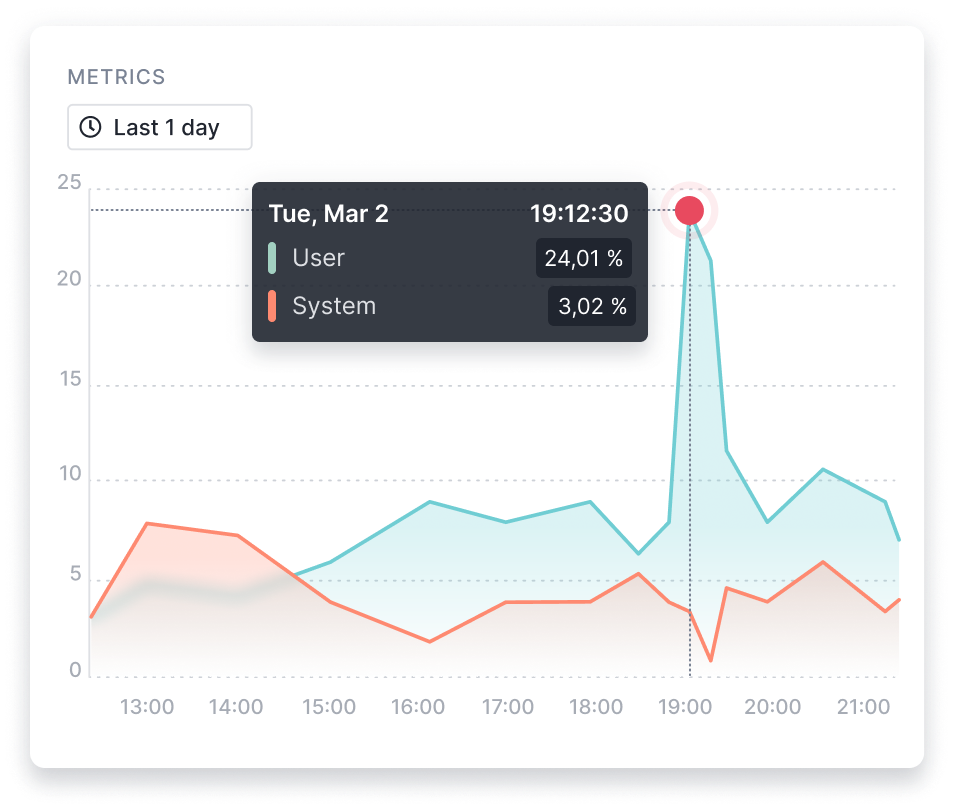
Metrics
Real-Time Visibility into Your CentOS Linux Hosts
Monitor dozens of Linux-specific infrastructure metrics such as the CPU, memory, processes, disk utilization, package inventory, events, and much more.
View the Infra integration docs for a detailed list of metrics!
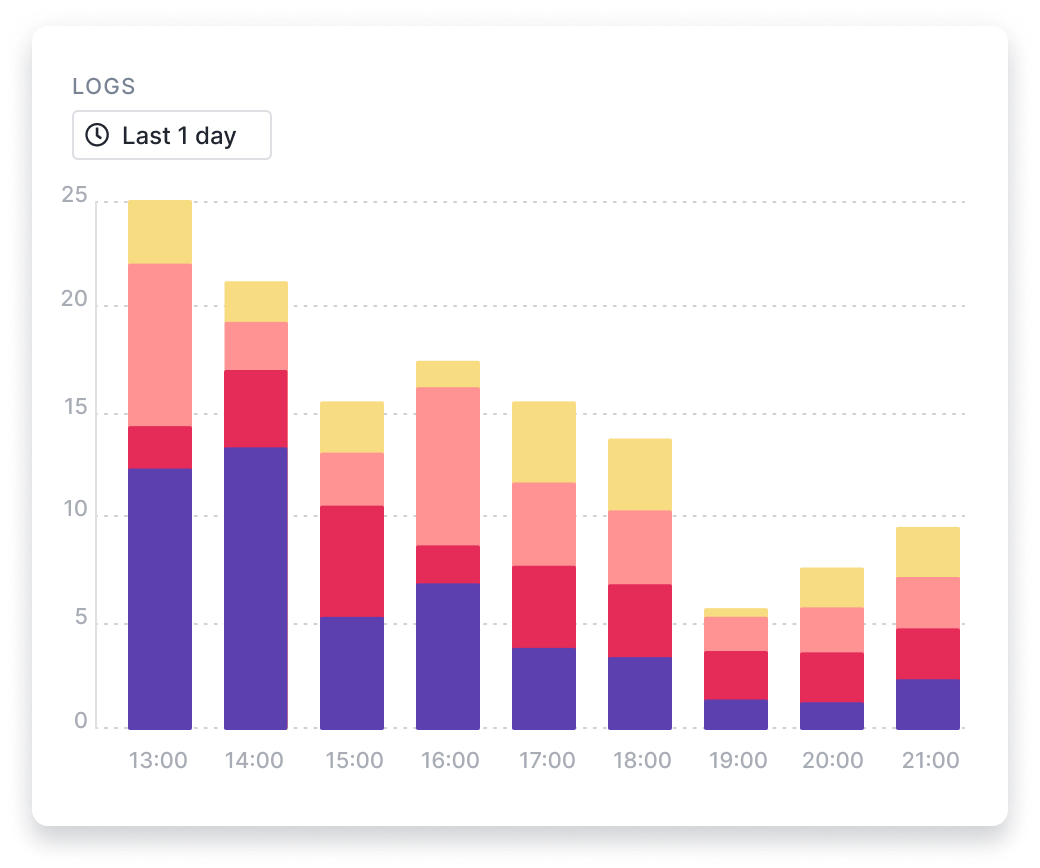
Logs
Troubleshooting Made Easy with Enriched Logs
Forward log files or Journald logs to Sematext for correlation with performance metrics and faster troubleshooting of your Linux hosts. Find CPU bottlenecks, hosts with low disk space, memory leaks caused by inefficient garbage collection cycles, and much more. Drill-down into errors faster, making troubleshooting and debugging easier.
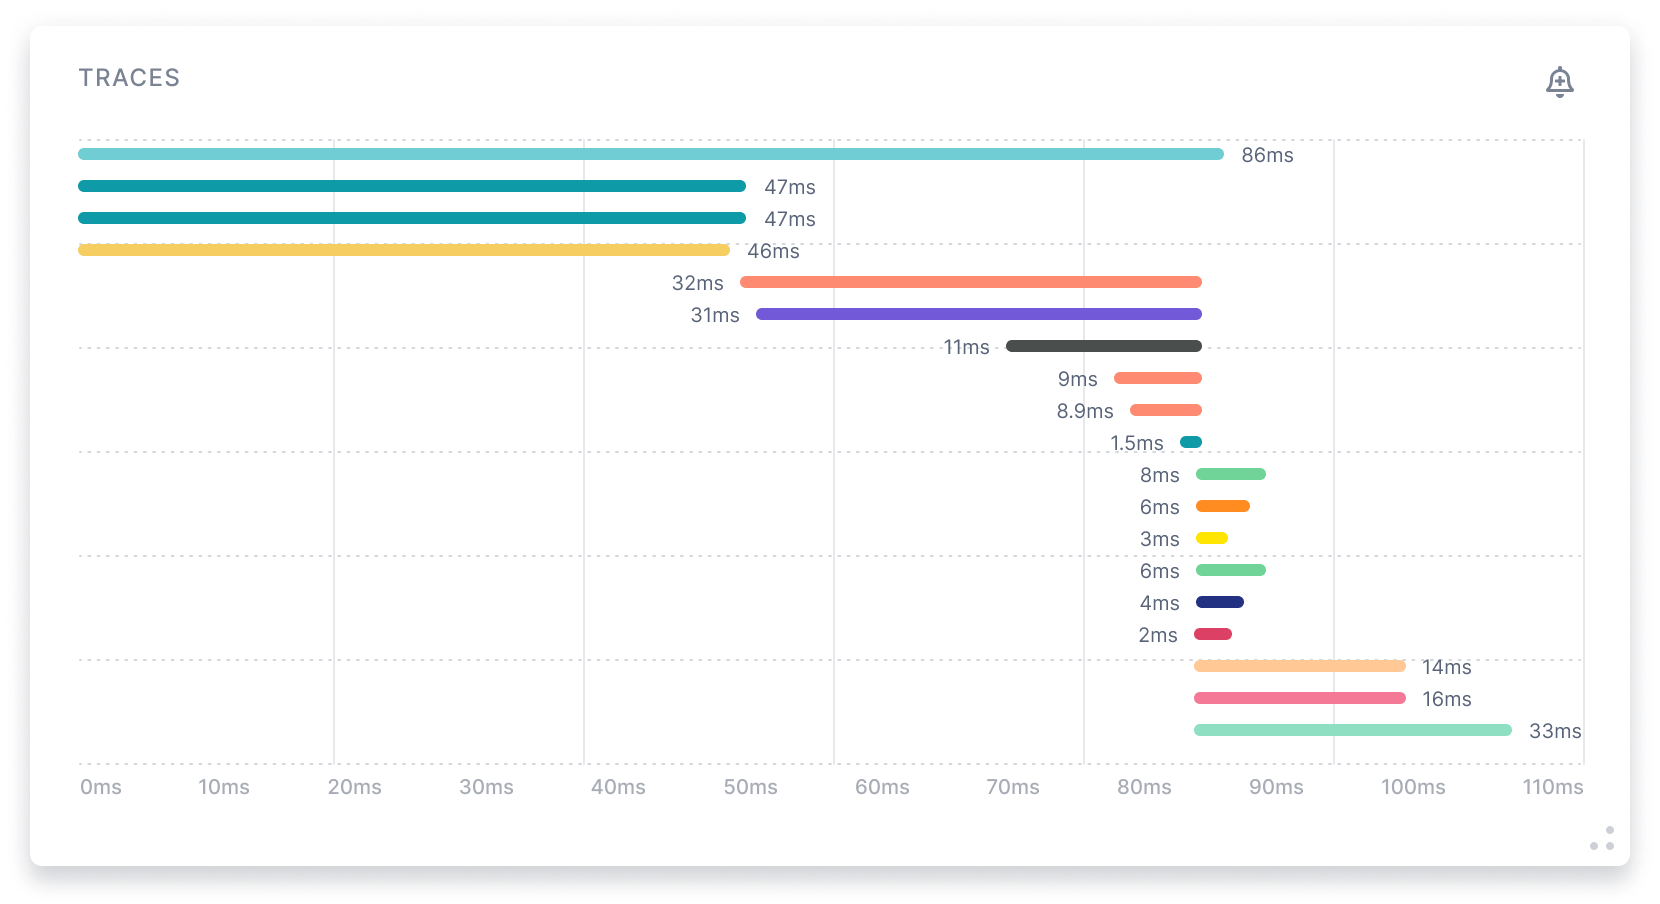
Traces
Gain Key Insights with Traces
To enable tracing you edit the agent’s configuration file to set tracing to enabled. As simple as that! Trace code execution from any back-end services and databases.
Alerts
Notify Your DevOps Team About Critical Issues
- Set up anomaly detection or threshold alerts
- Get alerted on both metrics and logs
- Invite team members. There is no limit on the number of users!
- Share logs and metrics with your team using role-based access control

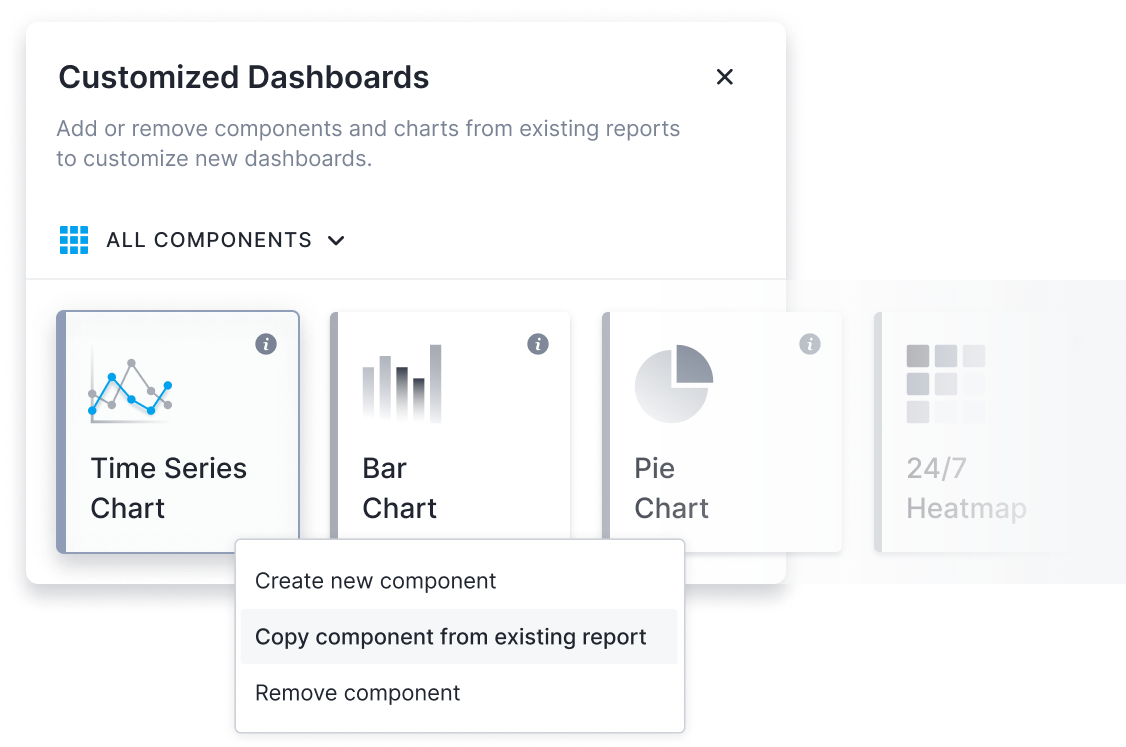
Dashboards
Benefit from Pre-Built Dashboards
- Benefit from out-of-the-box Infra dashboards with both host-specific metrics and Linux metrics
- Add or remove components and charts in existing reports to customize dashboards
- Add a new report page with your favorite metrics, charts, components, and filters
- Combine metrics and logs to cut troubleshooting time in half
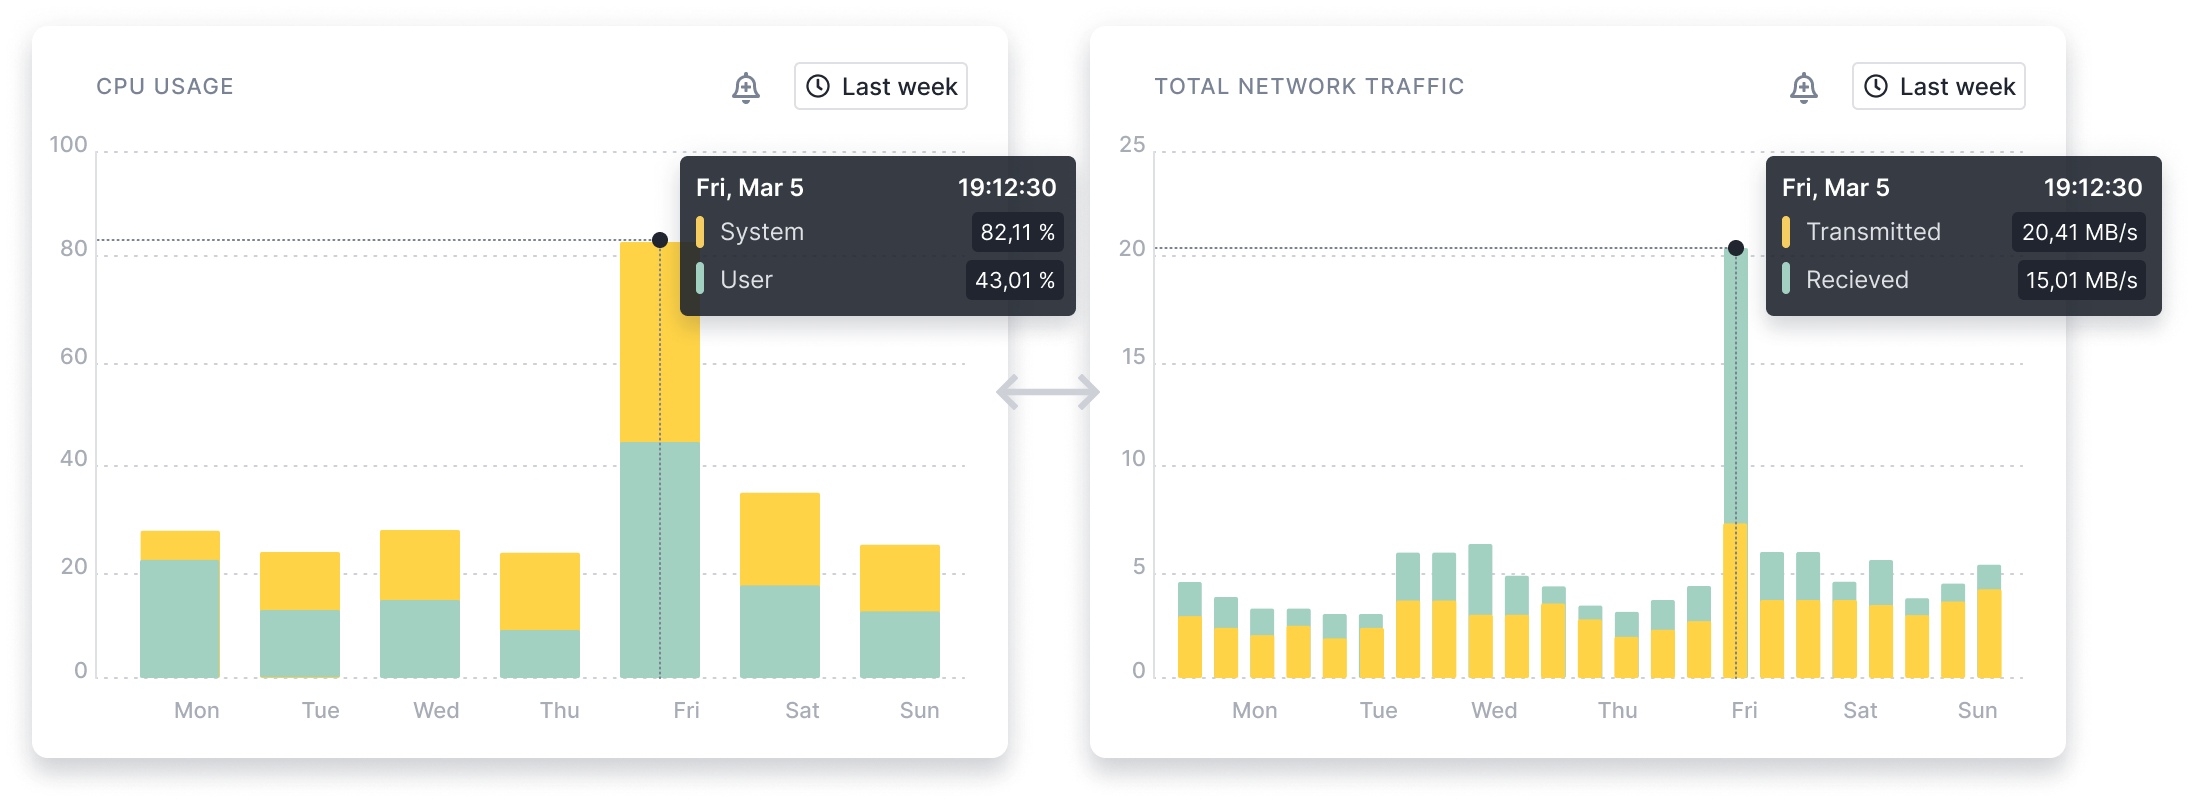
Correlation
Compare Any Two Reports in a Single View
With Split Screen you can compare any two reports. Split Screen is available across the whole product and you can open any report with events, logs, or metrics for easy correlation.
Sematext shows one unified view for all of our Docker log, events, and metrics!
 Ben Reichter
DevOps Engineer, Tozny
We looked into running our own Elastic Stack, and quickly realized that was a job and specialty within itself. We are a small startup and every dollar counts. Wasting precious and expensive sysadmin time on managing things far out of our project scope really isn’t an option
 Zach Aufort
CEO, BlockGen
Just looking at the default graphs it was clear I can reduce my serverless resource usage on Vercel by 90%, by reducing the allocated memory. Sematext simply turns your logs in actionable data, out of the box. Costs, performance, it's all there
 Andrei Vreja
Maker, iForge
Sematext Logs provides us a flexible, extensible and reliable means of monitoring all of our environments in real time
 Zach David
Test Automation Lead – Healthgrades
Sematext is great for monitoring SolrCloud, with out of the box dashboards and easy to setup alerts
 Chris George
Manager, VIPConsult