
Apache Cassandra Monitoring
Ensure the health and performance of your database with powerful Cassandra monitoring tools. Get real-time visibility into your Cassandra Metrics, Logs, and Events in Real Time.
monitoringdata storeNoSQL
Already have an account?
Sign in to get started.
What you get
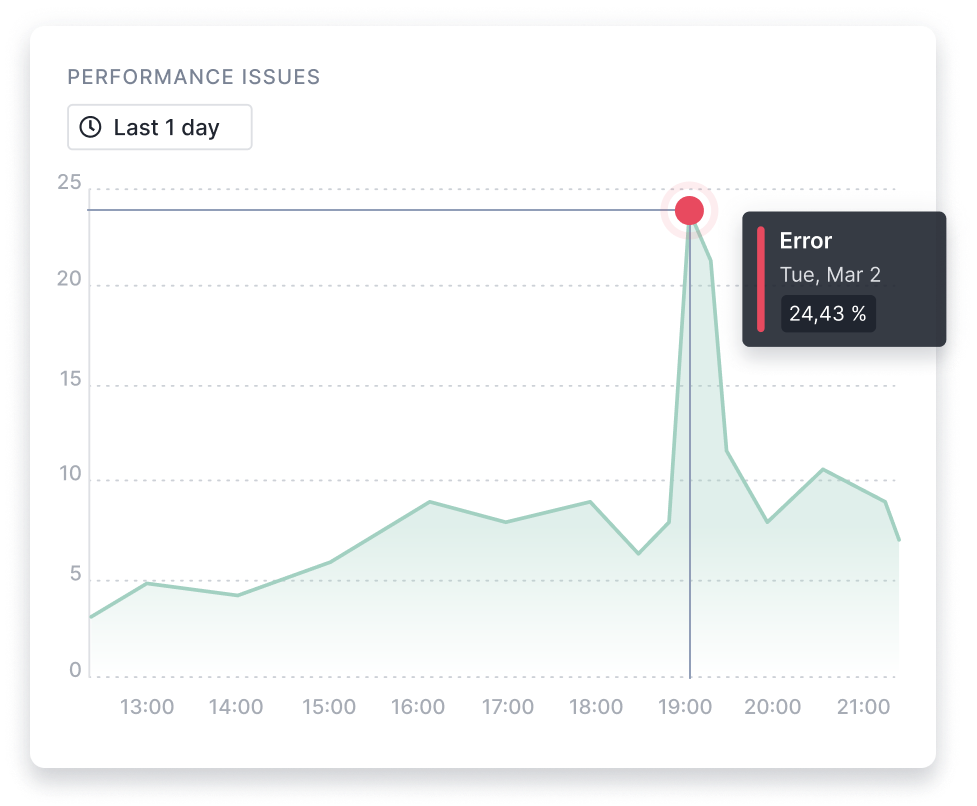
Detect Cassandra Performance Issues Faster
Sematext Monitoring makes life simpler by putting all Apache Cassandra metrics, logs, dashboards, and alerts at your fingertips. It’s an all-in-one solution with all the tools that you need to troubleshoot Cassandra node performance and health.
- Spot slow nodes that can degrade the responsiveness of the whole Cassandra cluster
- Get alerted on excessive or slow reads or writes
- Monitor pending or failed cluster operations, cache hits, etc.
- Keep tabs on SSTable compactions, counts, and sizes over time
Metrics
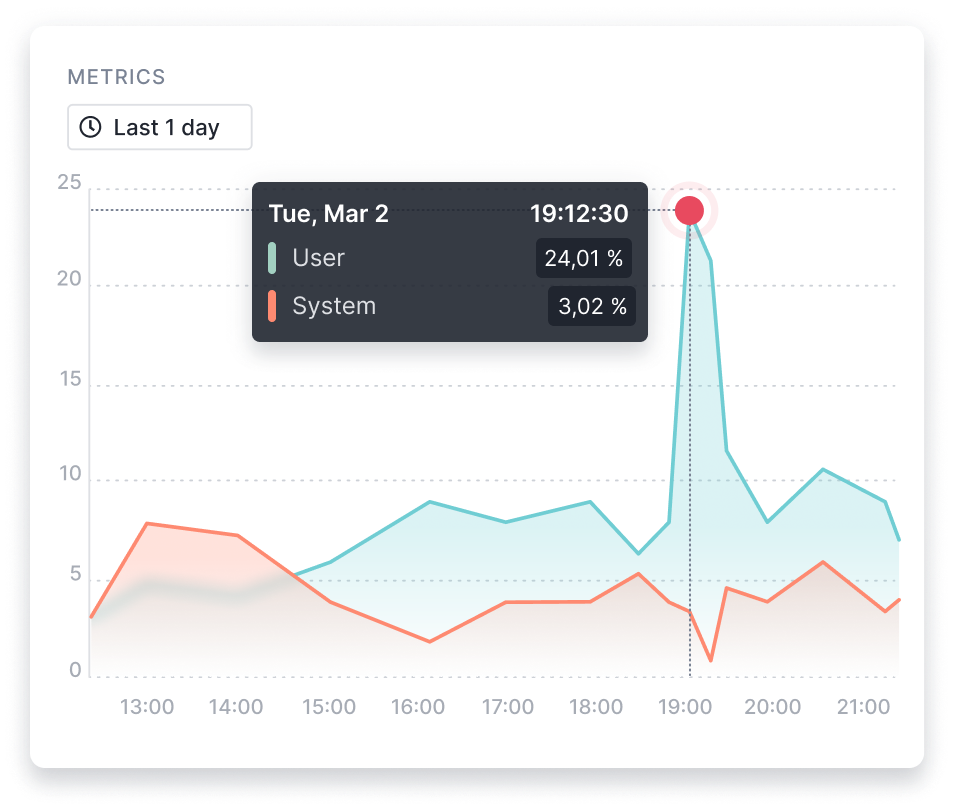
Track Critical Cassandra Metrics in Real Time
Sematext’s Cassandra monitoring tool measures key Cassandra performance metrics which you can then correlate with JVM metrics and JVM garbage collection logs and operating system metrics to gain deeper insights into the health of your database. Sematext is designed to keep track of all essential metrics, including:
- SSTable sizes and counts
- Bloom metrics like false positives, read and write latencies and request/response times
- Cluster metrics
- Node metrics
- Compactions and cache metrics
- Cluster tasks
View the Cassandra monitoring documentation for a detailed list of metrics!
Logs
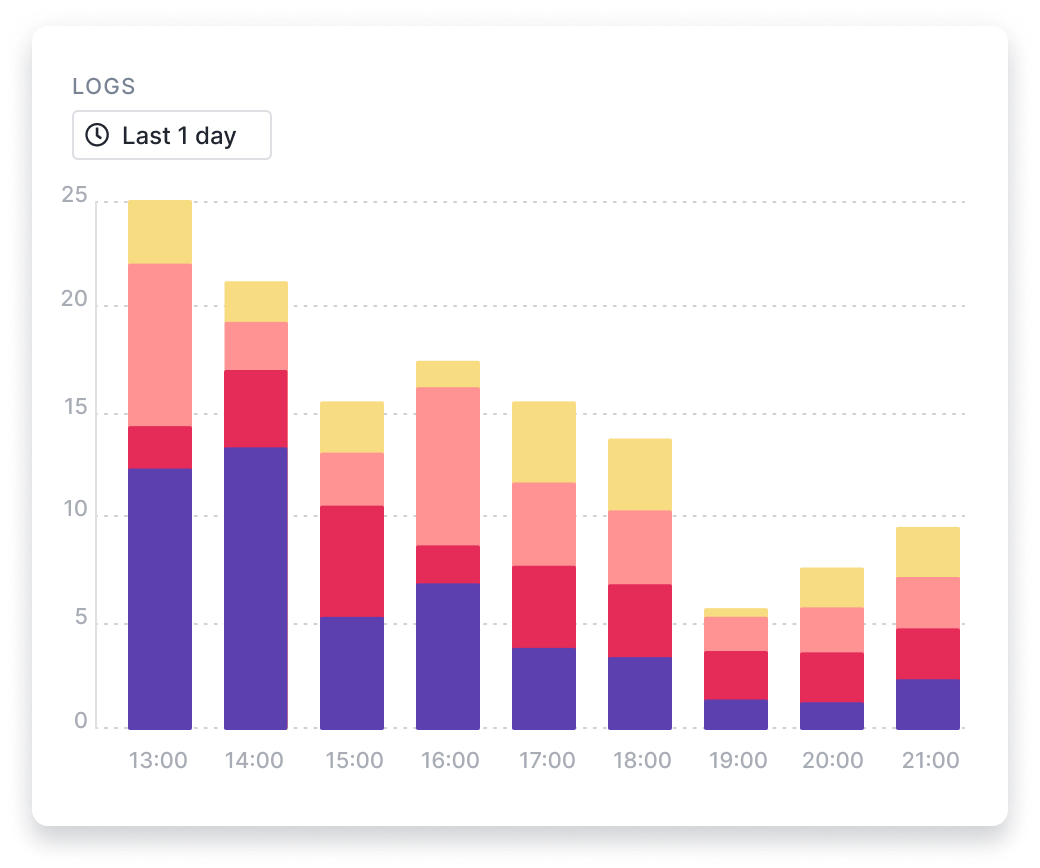
Monitor Apache Cassandra Logs for Faster Troubleshooting
Choose from a number of log shippers and libraries to aggregate and send your Cassandra logs to Sematext. Correlate logs and metrics to detect if your Cassandra nodes are under performing and find the root cause of problems and potential bottlenecks faster.
- Sematext Agent automatically discovers Cassandra logs for you
- Enable Cassandra log shipping directly via the UI
- Logs are automatically parsed and can be further transformed with Logs Pipelines at ingestion time
Dashboards
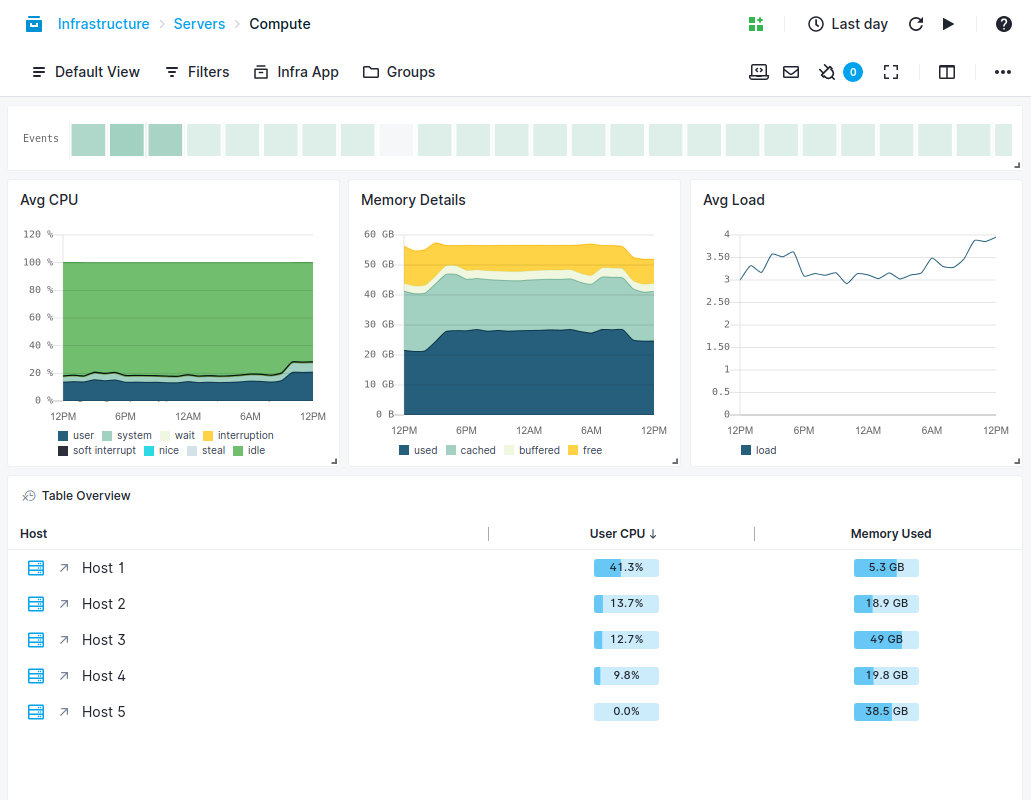
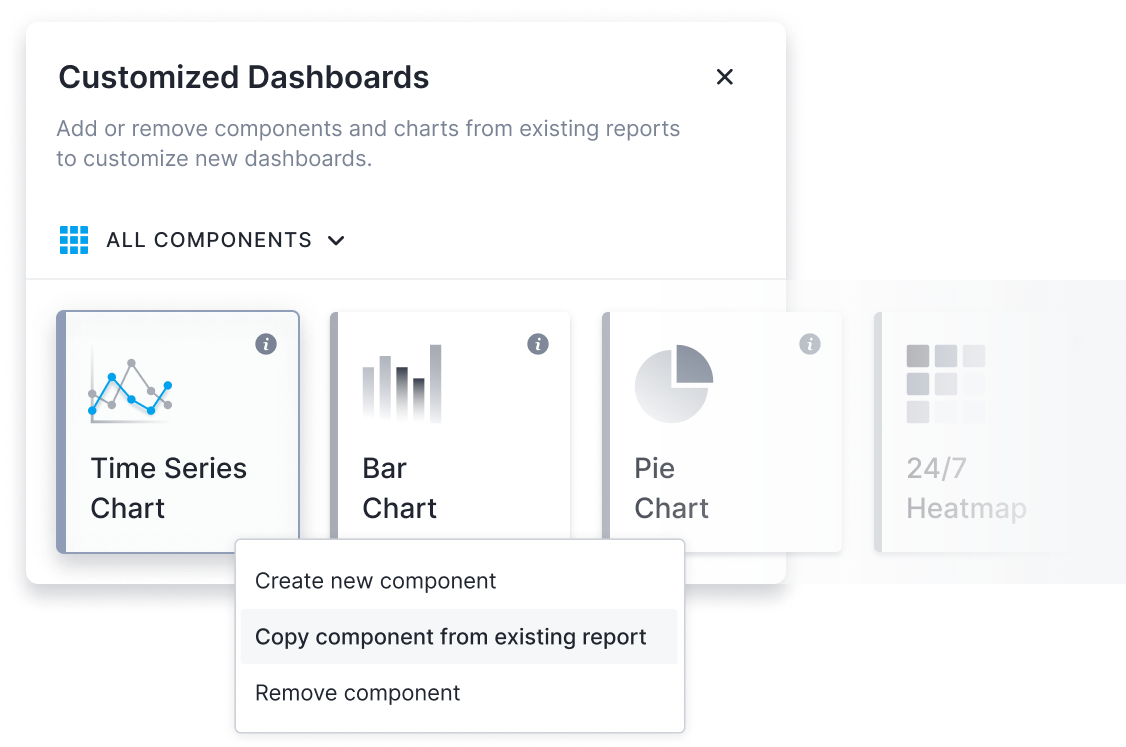
Benefit from Pre-Built Monitoring Dashboards
Sematext gives you out-of-the-box dashboards to continuously monitor the availability, health, and performance of your system.
- Get out-of-the-box monitoring charts
- Add or remove components and charts in existing reports to customize dashboards
- Add a new report page with your favorite metrics, charts, components, and filters
- Combine metrics and logs to cut troubleshooting time in half
Alerts
Notify Your DevOps Team About Critical Issues
Sematext allows you to stay on top of performance issues with customizable monitoring and alerting on any combination of metrics, filters, and logs.
- Set up custom anomaly detection or threshold alerts
- Send notifications to Slack, PagerDuty, ServiceNow, custom Webhooks, email, etc.
- Invite team members. There is no limit on the number of users!
- Share logs and metrics with your team using role-based access control

Correlation
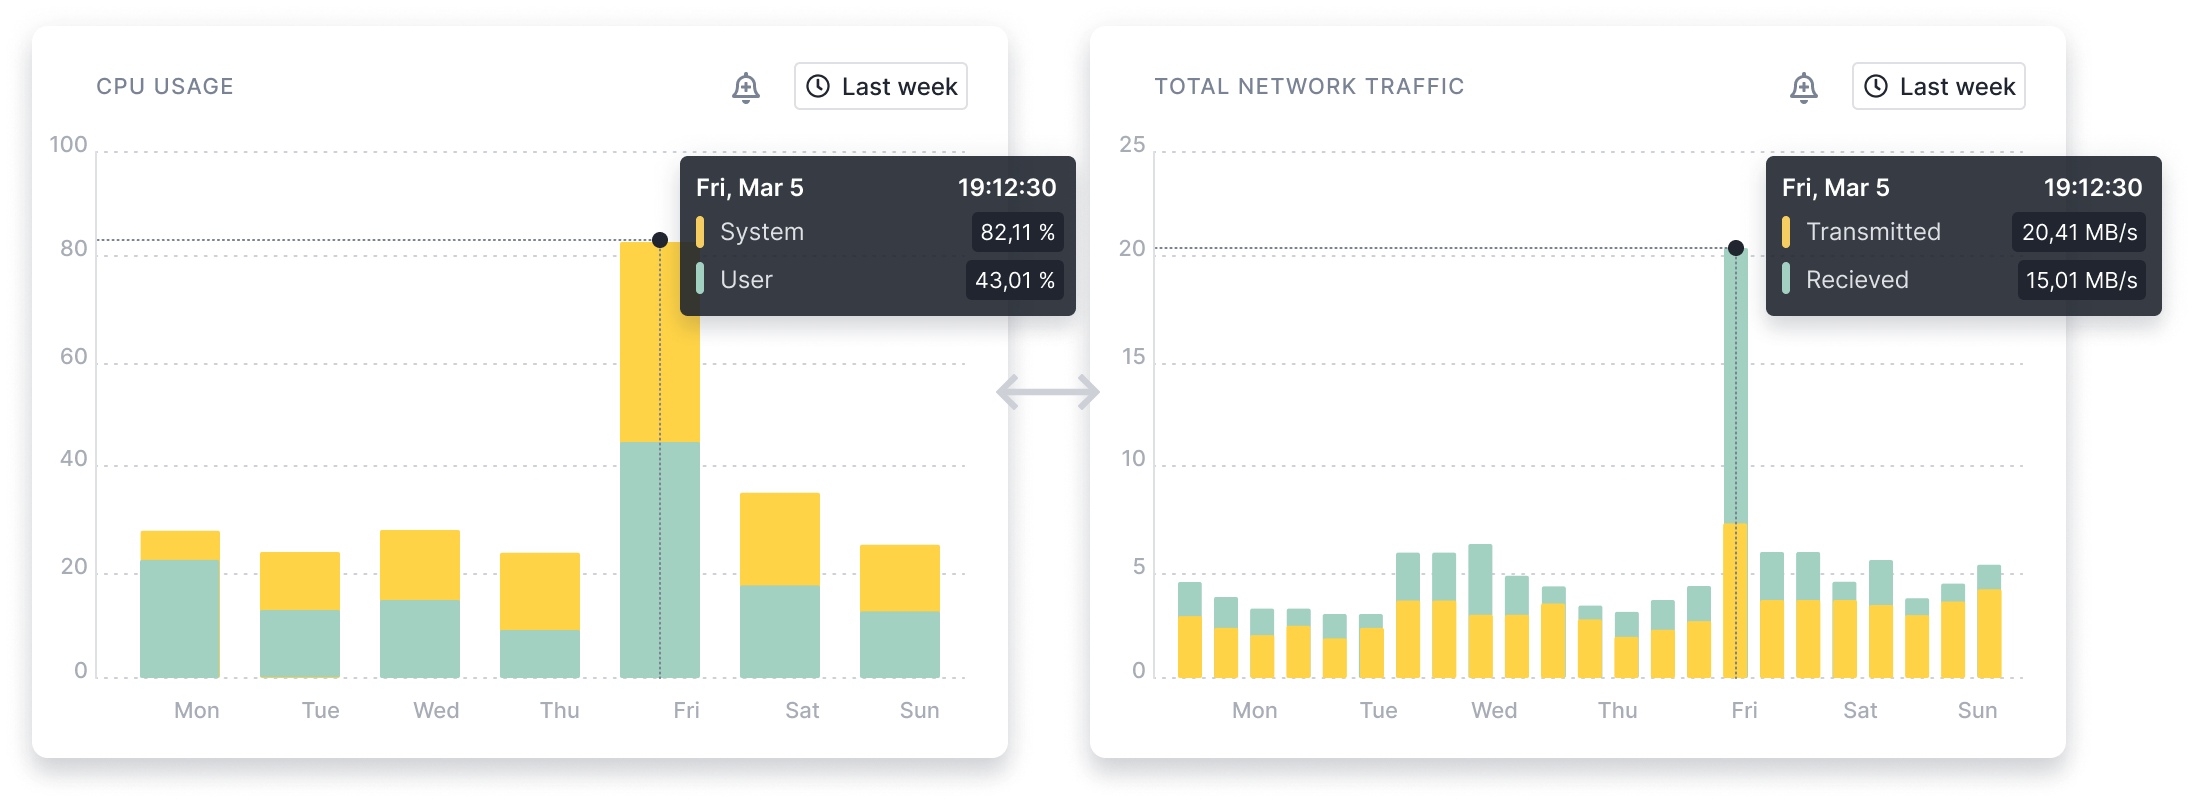
Compare Any Two Reports in a Single View
With Split Screen you can compare any two reports. Split Screen is available across the whole product and you can open any report with events, logs, or metrics for easy correlation.
Installation
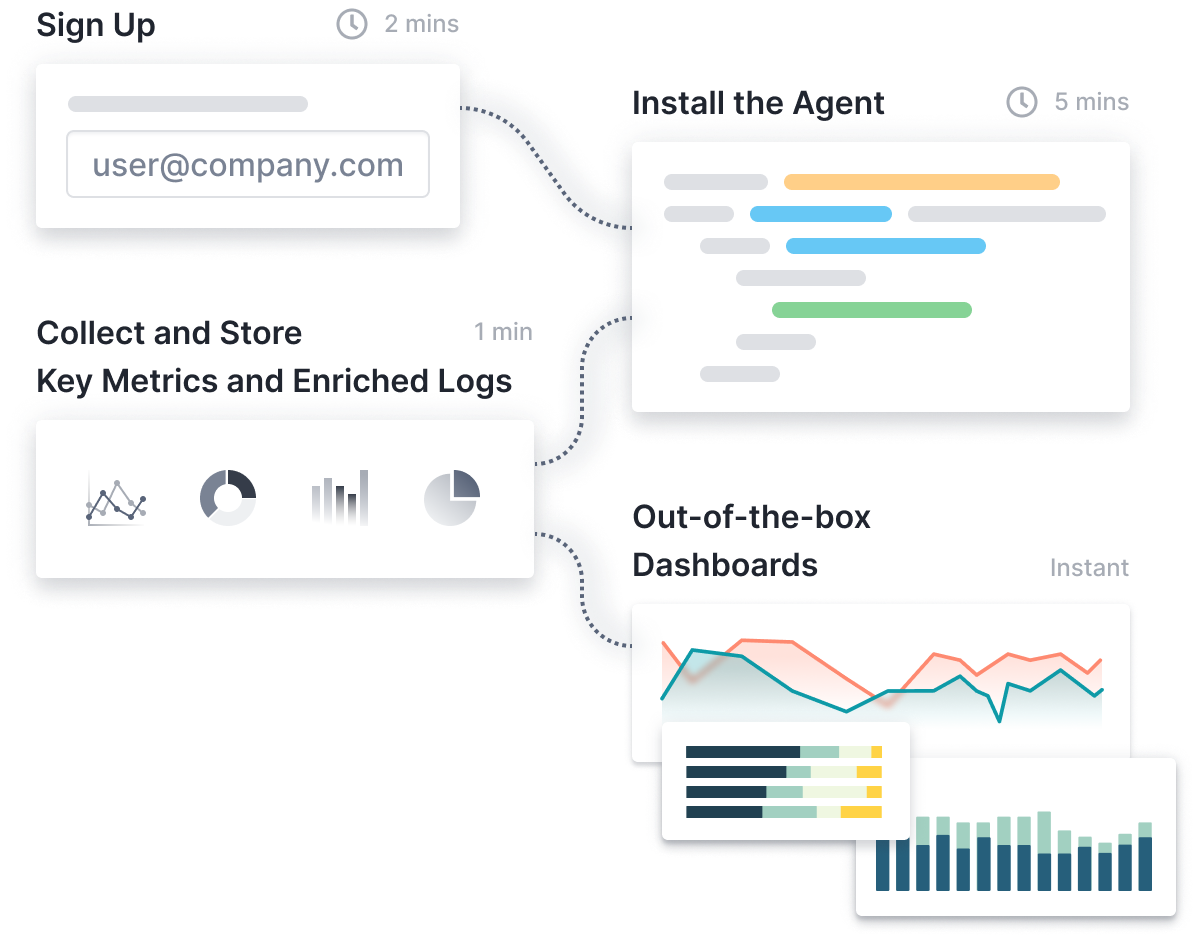
Start Monitoring Your System in Seconds
Sematext features a simple monitoring agent setup with extremely low overhead.
- Install the Sematext Agent in seconds.
- Supported across any environment, Linux, Docker, Kubernetes, and more
- Use Discovery to discover and monitor services inside containers
- Select which performance metrics and logs to collect from the UI
Plans-and-pricing
Sematext Monitoring pricing starts at $2.8/host/month.
There are no long-term commitments necessary, and the cost is usage-based. Monthly cost estimates for the current month are displayed in Sematext during the free trial to avoid any surprises and 100% transparency.
See Plans and Pricing
Insights
Get Meaningful Insights for Effective Monitoring
Get dozens of key metrics and logs at your fingertips. Sematext Monitoring offers robust and reliable tools to ensure the functionality and high availability of your applications and services.
Start Free Trial
- Ensure minimal downtime
- Benefit from predictable resource usage
- Scale effectively based on load
- Starts as low as $2.8/host/month
Just looking at the default graphs it was clear I can reduce my serverless resource usage on Vercel by 90%, by reducing the allocated memory. Sematext simply turns your logs in actionable data, out of the box. Costs, performance, it's all there
 Andrei Vreja
Maker, iForge
Sematext Logs provides us a flexible, extensible and reliable means of monitoring all of our environments in real time
 Zach David
Test Automation Lead – Healthgrades
Sematext shows one unified view for all of our Docker log, events, and metrics!
 Ben Reichter
DevOps Engineer, Tozny
Sematext is great for monitoring SolrCloud, with out of the box dashboards and easy to setup alerts
 Chris George
Manager, VIPConsult
We looked into running our own Elastic Stack, and quickly realized that was a job and specialty within itself. We are a small startup and every dollar counts. Wasting precious and expensive sysadmin time on managing things far out of our project scope really isn’t an option
 Zach Aufort
CEO, BlockGen